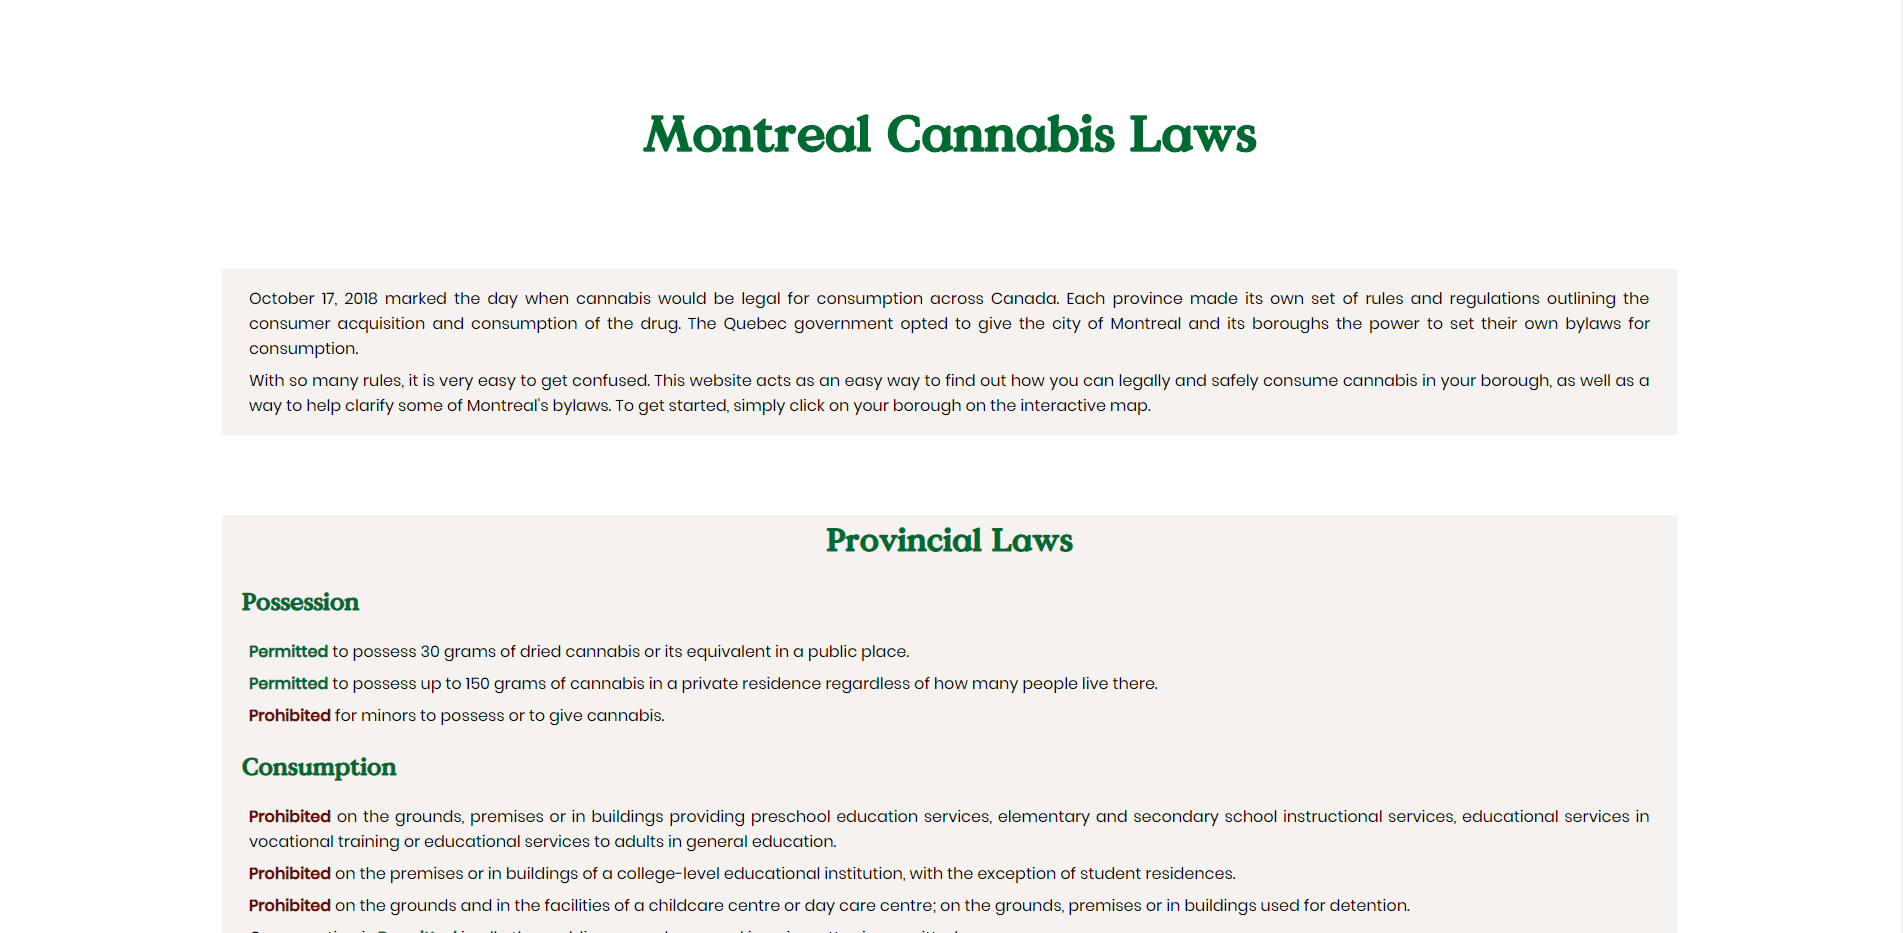
Montreal Cannabis Laws
Data-visualization Project
Timeline
October 2018
Responsibilities
Data-visualization / HTML / CSS / JQuery / Wireframing / Interaction-design
Team
Zach Ahmed
The Challenge
For this project I had to visualize a data-set realated to a current event. Since the legalization of cannbis was the hottest topic, I decided to visualize the laws for each borough in Montreal. My goal was to allow people to find what laws apply to them whever they may be in an easy to navigate way.
Process
Since this project had to be about a current event, I wanted to stay local. So I started looking for interesting things happening around Montreal. The biggest discussion that everybody wanted to be a part of was the legalization of recreational cannabis. Based on my research it seemed that a lot of people were concerned or confused about the laws, particularly in Montreal, because each borough had the control to make their own by-laws regarding how they wanted to control the substance.
With that information I decided that I wanted to take an educational route and to inform the public about what new laws they may or may not be subject to. From there I started looking into what laws the Quebec government had put in place, and researching what laws the various boroughs of montreal had planned to put in place.
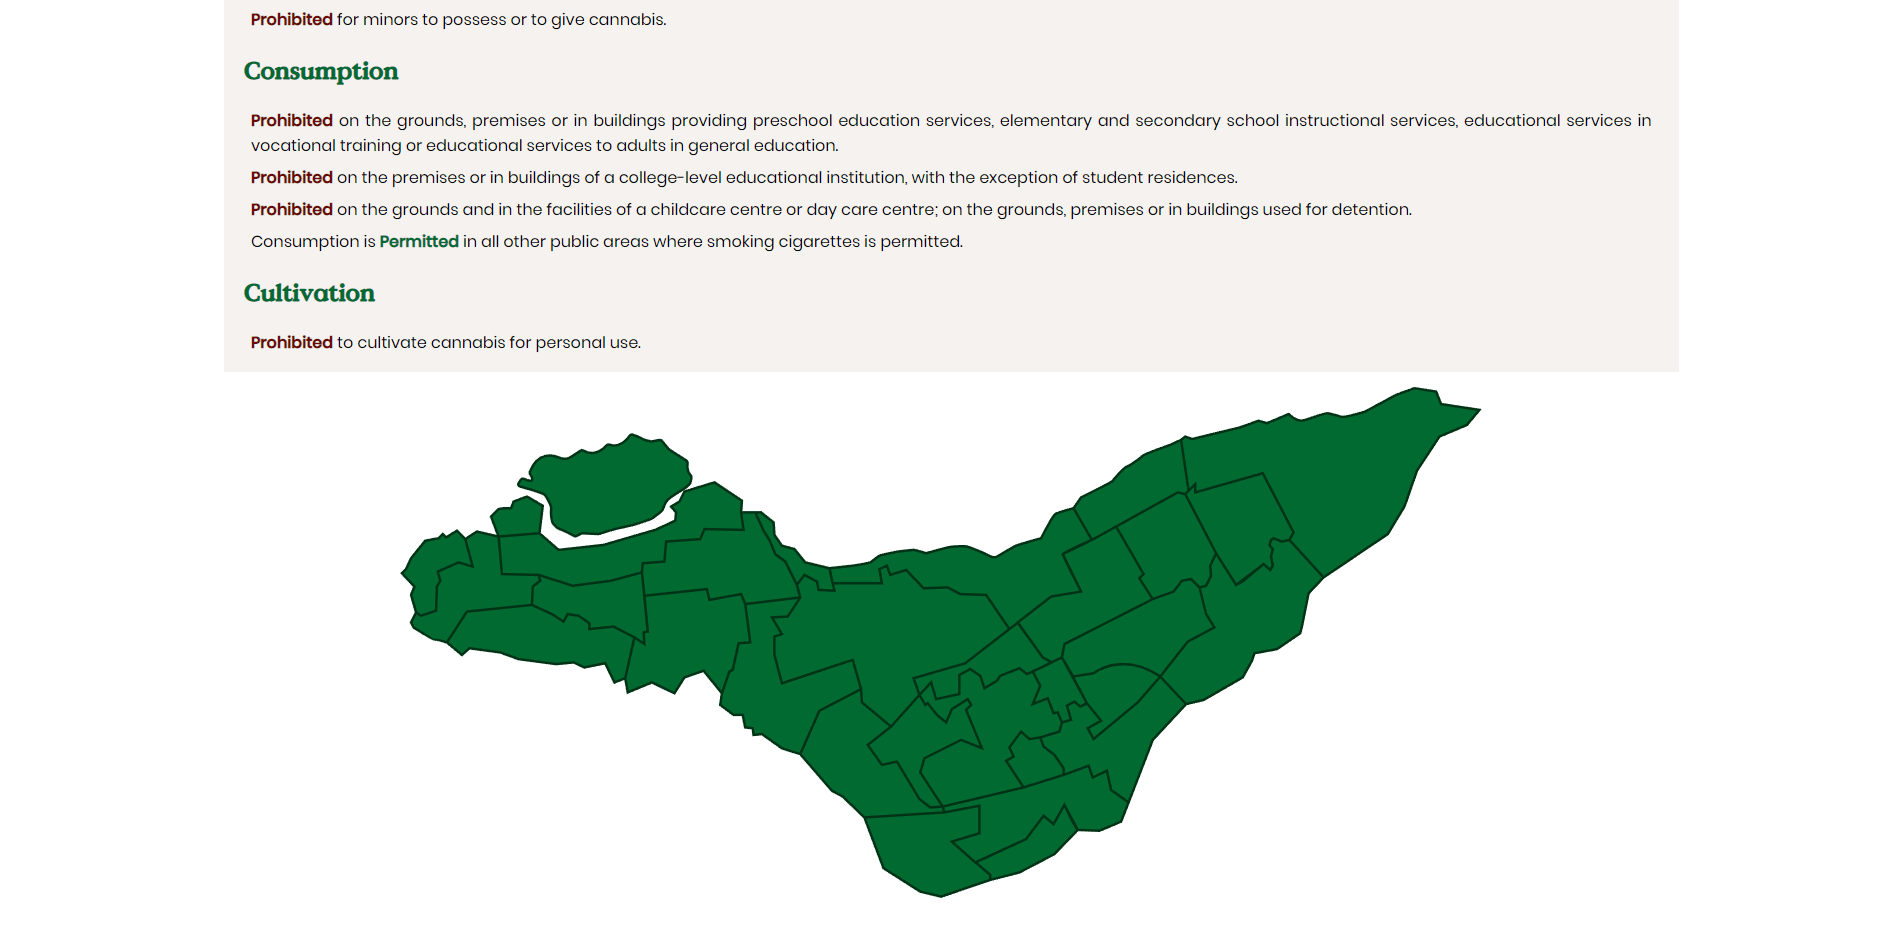
Once I gathered my data, I made an SVG map of Montreal and each individual borough so that I could interact with them on the web.
After my map was complete I started developing the website. I wanted to make it as simple as possible so that anybody who needed to use it could come across the information they needed. I styled the site in the same way as the actual SQDC site as if it were going to be included on their site.
Outcome
The outcome was that I made a site that is easy to use and that gives the users the information that they need as quickly and as easily as possible. I also learned a lot about how to use SVGs as interactive elements in a website.
Although I am happy with how the site turned out, I do see some areas of opportunity. If I were to redo the project I would add the borough names on the map, in case someone who doesn't know the city well enough wants to find where they are. I would also add a function so that the page would scroll back up to the start of the laws section after the user clicks on the map.